

ReliaSoft RBI
ReliaSoft RBI facilitates risk based inspection (RBI) analysis for oil & gas, chemical and power plants in adherence to the principles and guidelines presented in the American Petroleum Institute’s recommendations in the API RP 580 and RP 581 publications, as well as the American Society of Mechanical Engineers’ recommendations in the ASME PCC-3-2007 publication.

ReliaSoft RBI provides all the tools you need to manage RBI, RCM, FMEA and related analyses for all of your plant assets.
Full-featured Reliability Centered Maintenance (RCM) and FMEA / FMECA functionality is also included.
- Facilitates Risk Based Inspection (RBI) analysis according to latest guidelines and publications.
- Includes full-featured RCM and FMEA.
- Intelligent integration and multi user access enables you to build and manage knowledge base within your organization.
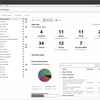
- Provides flexible reports, queries and dashboards to present analysis results in the most effective ways.
ReliaSoft Training >>
ReliaSoft Resources >>
Request a Trial >>
Benefits
- Rank assets using a customizable qualitative risk discovery rating system, and then use a quantitative analysis based on industry standards to predict the risk for selected assets.
- Develop an inspection schedule that optimizes inspection time and cost while maintaining acceptable risk based on the recommended inspection types and inspection date for each asset.
- Use Reliability Centered Maintenance (RCM) techniques to develop scheduled maintenance plans that will provide an acceptable level of functionality, with an acceptable level of risk, in an efficient and cost-effective manner.
Capabilities
Quick Qualitative Risk Assessment
You can configure the risk discovery ratings feature to provide a quick qualitative RBI analysis that can save time and effort by estimating an asset’s importance in terms of risk. By doing this quick assessment, you can focus your limited resources (both time and money) on those assets that pose the greatest risk, both physically and financially.
Reuse Existing Analysis Data or Phrases
The software provides an array of tools to help you find and reuse descriptions from any existing analysis and to select phrases from predefined templates or phrase libraries. You also can use fully customizable Excel® templates to quickly import system configurations and/or analysis data from external data sources.
For the specific components that are eligible for RBI analysis (compressors, heat exchangers, pipes, pressure vessels, pumps, tanks and pressure relief devices), the software guides you to select the specific equipment and component type that will determine which analysis inputs are required. For other types of equipment that might receive only RCM, FMEA or a related analysis, it’s easy to add the items one at a time. To save time and ensure consistency, you also have the option to automatically import system configuration data from an external Bill of Materials file or from ReliaSoft XFRACAS web-based failure reporting and incident tracking system.
Data Management Systems Score for the Plant
Because the procedures and personnel in a particular plant will affect the risk, the RBI analysis method includes an adjustment factor that accounts for the influence of the plant’s supervisors and management on the mechanical integrity of the plant equipment.
The software makes it easy to set and adjust this factor for any given analysis project. The flexible tool gives three options:
- The software can guide you through the detailed assessment recommended by the API standard and calculate the score for you.
- If you have already performed the assessment for a prior analysis, you can quickly enter the score without having to repeat the full questionnaire again.
- You can start with an average score until you have the time and knowledge to complete the full assessment.
Risk Based Inspection Analysis (RBI Analysis)
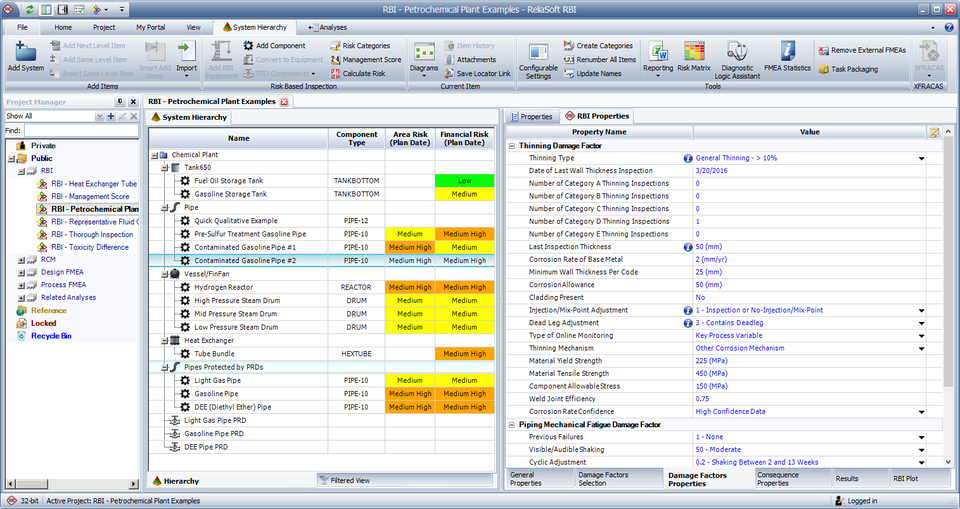
For the components that need the detailed quantitative analysis, the software includes all of the equipment and components listed in the American Petroleum Institute’s RP 581 document for risk-based inspection technology. This includes compressors, heat exchangers, pipes, tubes, tanks, HEXTUBEs and pressure relief devices. When adding a component, RBI provides a wizard that guides you through the steps of defining the general properties and selecting the applicable damage factors. You can then enter the relevant damage factor properties and consequence properties and finally generate the results.
- Quick Qualitative Risk Assessment
- Select and Describe the Damage Factors
- Describe the Consequences of Failure
- Generate the RBI Results
Full-Featured Reliability Centered Maintenance (RCM) Analysis
The RBI software provides full-featured support for reliability centered maintenance (RCM) analysis, which can be used independently or in conjunction with your RBI analyses.
Equipment Selection: In order to focus resources where they can provide the greatest benefit, the Risk Discovery Analysis feature provides a choice of two configurable methods to determine which equipment will be analyzed with RCM techniques.
Functional Failure Analysis: The Analysis panel makes it easy to switch back and forth between three complementary views of the functional failure analysis information so you can choose the display that is best suited for your current activity.
- FMEA Hierarchy displays a lot of information in a compact space. You can also choose to display and enter causes before effects, if desired.
- Worksheet View allows you to type directly in the worksheet cells and tab through the analysis as you would in a spreadsheet application such as Microsoft Excel.
- Filtered View allows you to generate sortable lists of records of a particular type.
Failure Effect Categorization and Maintenance Task Selection: The software supports the failure effect categorization (FEC) and maintenance task selection logic charts in the major industry RCM standards. You also have the option to customize the questions, categories and task types to fit your own specific analysis procedures.
Task Packaging: The Task Packaging feature makes it easy to group individual tasks into packages based on factors such as time, task type and areas in the system where tasks are performed. You can manually assign a task to the appropriate maintenance package or allow the software to automatically group tasks based on the criteria that you have specified for each package. This tool makes it easy to experiment with different intervals and provides a graphical chart to help you visualize the packages that are under consideration.
FMEAs and Related Analyses
The RBI software provides a complete set of features for FMEA and related analyses, which can be used independently or integrated with any RCM or RBI analysis.
Risk Priority Numbers and Criticality Analysis: Risk Priority Numbers (RPNs) are calculated automatically based on your selections from fully configurable rating scales. The software supports related metrics, including SxO (Severity x Occurrence), SOD (Severity, Occurrence, Detection) and SD (Severity, Detection).
The Priority Highlights feature allows you to highlight issues in the interface and report/query output based on specified criteria. The software facilitates both quantitative and qualitative Criticality Analysis.
Tracking the Completion of Recommended Actions: One of the most costly mistakes among FMEA practitioners is the failure to properly follow up and track the completion of recommended actions. The software provides multiple features to make sure that your organization implements necessary improvements to reduce the risk in the product/process design. This includes targeted reports, charts and the ability to send automated notifications via e-mail.
Change Log and Electronic Approval Tracking: When an authorized user activates the change log for a particular FMEA or DVP&R analysis, the software will record a history of the specific changes made in each tracked revision. In addition to the date/time and details of the change, the software can be configured to prompt users to record an explanation for each modification. If desired, this utility also can store an electronic record of the users who have reviewed and approved each tracked version of the analysis.
Support for Related Analyses: The software provides configurable utilities for:
- New Test Plans feature (generated automatically from relevant actions in the FMEA)
- Design Verification Plans and Reports (DVP&Rs)
- Process Flow Diagrams (PFDs)
- Process Control Plans (PCPs)
- Design Reviews Based on Failure Mode (DRBFMs)
Queries, Reports, Charts and Diagrams
RBI provides a complete range of options for presenting your analysis data in ways that will effectively communicate results and facilitate decision-making.
Configurable Queries and Print-Ready Reports: Use the Templates Manager to manage predefined and customized templates that can be made available to all database users, applied to any data set and incorporated into any print-ready report document.
The Query Utility window is a powerful analysis tool that makes it easy to find and open specific sections of the analysis. It is also a flexible custom reporting tool that allows you to create and manage saved queries that meet your particular presentation requirements.
The Reports window makes it easy to build report documents that include the predefined report forms, custom report forms and/or custom queries that will be most effective to present your analysis results. Since you can generate these documents directly in Microsoft Word or Excel, it is easy to customize and distribute reports without a specialized report editor or viewer.
In addition, if your organization chooses to implement a web-based Synthesis Enterprise Portal (SEP) for an enterprise database, you can also publish these reports to the portal (in Word, Excel, PDF or MHTML format), where they can be accessed from any web-enabled device.
Graphical Charts and Relationship Diagrams: The Plot Viewer provides an array of flexible options to create attractive bar charts, pie charts and matrix charts based on the analysis data. The software also generates Cause and Effect Diagrams and Failure Relationship Diagrams to help you visualize the relationships between issues in your analyses.
FMEA/FMRA Dashboards: You can create customized dashboards to present data from FMEA and FMRA analyses in Xfmea/RCM++/RBI. In addition, if your organization chooses to implement a web-based portal for an enterprise database, you can share selected dashboards to be accessed from any web-enabled device.
What's New in Version 2019?
Teams / multiple crews for tasks
In Version 2019, users are able to assign tasks to crews as a part of the teams. This allows users to require multiple crews to complete a task. Teams for task allows you to choose or create one or more teams that can perform the task. Each team is made up of one or more crews; all crews assigned to the team are considered to be required. You can add, remove or edit the crews assigned to any team. You can also remove a team from the task, thereby quickly removing all of its crew associations.
If multiple teams are assigned to the task and a team is needed, they will be checked for availability in the order in which they are displayed in this list. If a team is needed and all teams are engaged, the team with the shortest wait time is chosen to perform the task.
Multiple spare part pools for tasks
Starting in Version 2019, tasks can request multiple spare parts from a pool. All requested parts must be delivered before the task can be performed. In addition, multiple spare part pools can be assigned to tasks.
For each task, you now need to specify a quantity of parts requested from the pool by the task. The default value in the Quantity requested by task field is 1.
You can also assign multiple spare part pools to a task. In this case, the task is assumed to require all requested parts from all requested pools.
Spare part pool profile models for cost and duration
New in Version 2019, profile models can be used to define any acquisition time and non-holding costs. This new model type allows you to model changes in cost and duration over time. You can also still use all other model types for these fields.
Update RBI to American Petroleum Industry RP 581 Rev 3 (2016)
Starting with Version 2019, RBI will be configured to follow the API RBI Rev 3 (2016) standard and all calculations and recommendations that follow.