

ReliaSoft Synthesis Enterprise Portal (SEP)
The web-based Synthesis Enterprise Portal (SEP) enables your entire organisation or team — including managers and colleagues who don’t have the ReliaSoft desktop applications installed — to access key analysis and project management details from any web-enabled device.

Overview
SEP provides a personalised overview for each user, with quick and convenient access to the metrics, analysis summaries, dashboards, assigned actions and messages that are relevant to you.
- Actions and messages
- Project summaries and project plans
- FMEAs, queries and reports from XFMEA, RCM++ or RBI
- Analysis summaries from Weibull++, ALTA, RGA, BlockSim, RENO or Lambda Predict
- Drill down to the full analysis in desktop application
- Dashboards and reports
- Links to XFRACAS reports, actions or incidents
Benefits
- Convenient to access while on-the-go, or without having the desktop applications installed
- Monitor key performance indicators (KPIs)
- At-a-glance summaries to track progress for FMEAs
- Distribute lessons learned and troubleshooting advice captured in FMEAs
- Share summaries, plots and reports from data analyses and simulations
- Update and track progress for assigned actions
- Run ReliaSoft desktop applications without installing and updating software on each client computer (additional hardware and license requirements)
Capabilities
Reliability Analysis Summaries and Metrics
For selected reliability analyses performed in Weibull++, ALTA, RGA, BlockSim, RENO or Lambda Predict, your team can publish summaries, plots or reports for access within SEP.
Each user can choose the metrics, dashboards and reports they wish to monitor via the website.
FMEAs, Queries and Reports
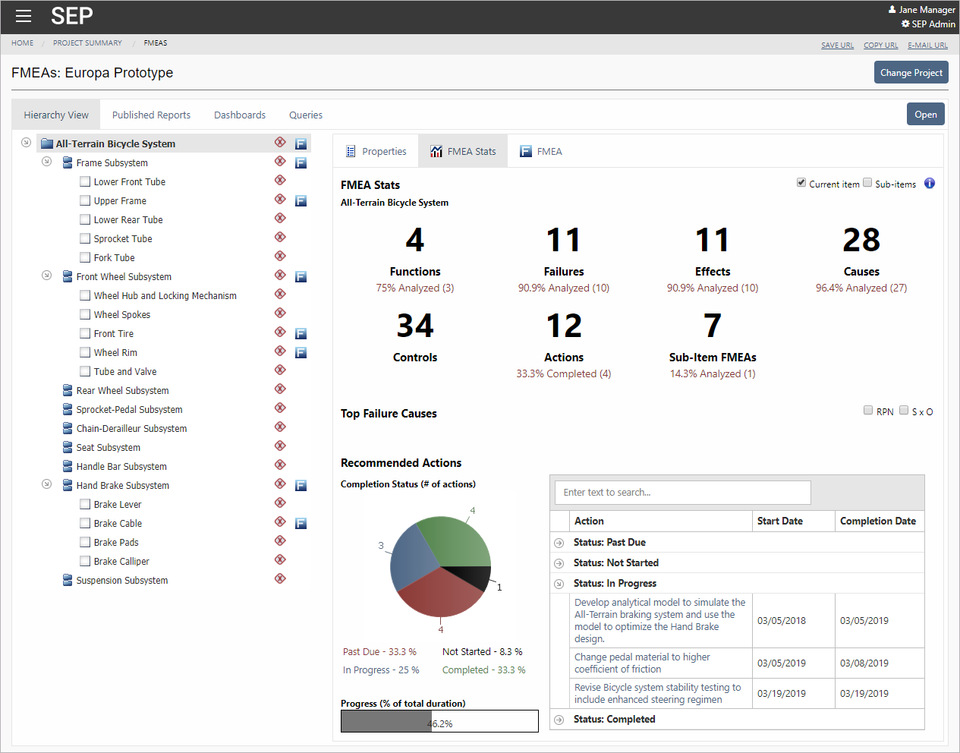
SEP provides convenient mobile access for managers and others throughout your organization to view the latest data from FMEAs performed in XFMEA, RCM++ or RBI.
The website offers at-a-glance summaries to track progress for FMEA projects, top failure modes and the status of actions assigned to reduce risk, such as:
- Priority highlights based on RPN, SxO or customized risk ranking
- Quantity of functions and failure modes, with % analyzed
- Top 10 failure modes
- Assigned actions, with % complete, in progress, past due or not started
- Change log status and the ability to approve versions assigned to you
- Results from your own custom queries
Drill Down to the Full Analysis
When you’re using a PC or laptop, SEP makes it easy to open the full analysis in the relevant ReliaSoft desktop application. If the website is configured for “Remote ReliaSoft,” users can launch the applications on a remote server without having to install and update software on each client computer.
“Remote ReliaSoft” requires at least one Windows server with Microsoft Remote Desktop Services (RDS) and RDS license seats purchased from your preferred Microsoft vendor. Locally hosted licensing is recommended for ReliaSoft applications (Token-based or Floating).
Assigned Actions and Project Plans
SEP enables your team to track and report progress for assigned actions, and provides a streamlined mobile view for project plans. If the Synthesis Service is running on the SEP web server, you can choose to trigger action alerts based on the planned completion date.
“Watch” Dashboards and Reports
SEP can display a wide variety of graphical dashboards and customized reports based on analysis data from desktop applications. The “Watch” feature makes it easy to manage the specific dashboards and reports you want to be able to access quickly.
Links to XFRACAS for Incident Tracking and Problem Resolution
You can deploy SEP on the same database and web server with ReliaSoft XFRACAS, a highly configurable failure reporting, analysis and corrective action system. When implemented together, SEP links to the FRACAS records assigned to you, and enables FMEA teams to review relevant field failure reports for the parts they are analyzing.
Scalable and Distributable Web-Based Architecture
Whether you have 15 users or 15,000 users, SEP is scalable and easy to distribute with nothing extra to install for each user. Your team can access the portal with their preferred web browsers (such as Internet Explorer, Chrome, Firefox or Safari) from a variety of devices (laptop, tablet, etc.).
If you plan to host the database and website on the same server, you will need:
- Windows 2008 R2 or newer
- .NET 4.6
- IIS with support for serving ASP.NET
- SQL Server (2008 or newer) or Oracle (10g or newer)
Whats New in Version 2019?
New web dashboards with flexibility to meet your preferences and needs
Your personalized SEP home page provides an intuitive, at-a-glance overview of the reliability results and tasks you’re tracking, such as metrics, assigned actions, recent messages, reports and more.
New in Version 2019, we rebuilt the dashboard from the ground up to provide a better user experience and more flexibility to configure the display to meet your personal preferences and needs.
- Easy drag and drop to move tiles – changes are saved automatically
- Resize tiles to the height and width that fits your content – not limited to pre-set layouts
- Maximize any tile with the click of a button
- Choose tiles from a gallery with filters based on category or text search
- Configurable tile settings
More configuration options for dashboard tiles
SEP 2019 supports all of the dashboard tiles that were available in prior versions, but now you have much more control to customize the data and display. Some notable enhancements include:
- Metrics – in addition to showing metrics that’s you’re personally tracking in SEP, now you can also create tiles that show all metrics from selected project(s)
- My Actions – in addition to choosing which type of actions to display (e.g., you’re responsible, you’re a member of the team, you’re the creator, etc.), now you can also filter by project
- FRACAS Incidents and Actions – if your team is using ReliaSoft XFRACAS for failure reporting and problem resolution, now SEP can show FRACAS incidents and actions from all your entities and you can choose which columns to display in the dashboard
Version 2019 also enables you to use multiple instances of the same tile type, with different configuration settings in each. For example, now you can use your dashboard to compare the metrics from two product lines side-by-side.
New dashboard tiles for tracking assigned actions
SEP 2019 introduces two new dashboard tile types that you can use to track actions assigned in FMEAs or other reliability project planning.
The Actions Grid tile shows a list of actions from one or multiple projects, with configurable settings to filter the data and choose which columns to display. For example, now it’s easy to get a list of actions that are past due and not assigned to a person responsible. Or check the status of all actions assigned to a particular user, sorted by due date. Or monitor the actions in an FMEA that are not yet complete. Simply configure the tiles to highlight the details you need to monitor and track.
The Actions Pie tile offers the same filters as the grid and uses an interactive pie chart to display the data based on Status, Person Responsible and/or Project.
New permission controls ability to open desktop apps from SEP
SEP provides a convenient way for users throughout your organization to view the latest reports and results from reliability analyses performed in ReliaSoft applications. For all supported analyses – from FMEAs to Weibull analyses to system simulations – the website’s “Open” buttons provide a convenient way to drill down to the full analysis in the relevant desktop app.
New in Version 2019, you now have the option to hide these buttons for users who are not authorized to use the desktop tools.
Enhancements to web access for FMEAs
When your organization implements SEP together with ReliaSoft XFMEA, the web portal provides convenient mobile access for managers and others throughout your organization to view the latest FMEAs, queries and reports.
SEP supports two new enhancements that were added to XFMEA in Version 2019.
- Reject change logs – if you’re assigned to review an FMEA that’s under tracked revision control, now you can choose to either Approve or Reject the analysis
- Effect sub-severities – if the analysis is configured to use sub-severity ratings to calculate the overall impact for each effect, the read-only record properties in the website will show the new ratings