

ReliaSoft BlockSim
ReliaSoft BlockSim provides a comprehensive platform for system reliability, availability, maintainability and related analyses.
The software offers a sophisticated graphical interface that allows you to model the simplest or most complex systems and processes using reliability block diagrams (RBDs) or fault tree analysis (FTA) — or a combination of both approaches. Markov diagrams are also available.
Using exact computations or discrete event simulation, BlockSim facilitates a wide variety of analyses for both repairable and non-repairable systems that will be of use to both product designers and asset managers. This includes reliability analysis, maintainability analysis, availability analysis, reliability optimization, throughput calculation, resource allocation, life cycle cost estimation and other system analyses.
- Supports an extensive array of reliability block diagram (RBD) configurations and fault tree analysis (FTA) gates and events.
- Advanced capabilities to model complex configurations, load sharing, standby redundancy, phases and duty cycles.
- Facilitates a wide variety of analyses for both repairable and non-repairable systems.
- Throughput calculation helps you to identify bottlenecks and estimate production capacity.
- Performs realistic Life Cycle Cost assessments.
ReliaSoft Training >>
ReliaSoft Resources >>
Request a Trial >>
Benefits
- Identify critical components (or failure modes).
- Determine the most effective ways to improve system performance through design improvements and/or maintenance planning.
- Use simulation to obtain estimated performance metrics that can facilitate decision-making in a variety of areas, such as:
- Model any configuration to analyze its reliability, maintainability and availability using load sharing, standby redundancy, phases and duty cycles to represent the system.
Capabilities
Reliability Block Diagrams (RBDs)
Easy drag-and-drop techniques allow you to build reliability block diagrams (RBDs) for the simplest to the most complex systems.
- Simple Series and Parallel: Simple series configuration assumes that the failure of any one component causes the system to fail, while simple parallel configuration assumes full redundancy in the system.
- Complex: Require a more advanced analytical treatment than a simple combination of series and parallel blocks. Such configurations may be required for analyzing network systems, competing failure modes, etc.
- k-out-of-n: Node blocks can be used to define k-out-of-n redundancy, where a specified number of paths leading to the node must succeed in order for the system to succeed.
- Load Sharing: Each block supports a percentage of the total load. BlockSim supports stress-independent distributions for load sharing blocks.
- Standby Redundancy: Standby blocks are available to become active under specified circumstances. BlockSim can model hot, warm or cold standby configurations.
- Mirrored Blocks: Allow you to put the exact same component in more than one location within the diagram. These blocks can be used, for example, to simulate bi-directional paths in a communications network. BlockSim offers increased modeling flexibility by supporting mirrors across different diagrams.
- Multi Blocks: Help you to save time (and space in the diagram) by using a single block to represent multiple identical components configured in series or parallel.
- Subdiagrams: BlockSim offers a virtually unlimited capability to link diagrams as components in other diagrams, which provides a variety of opportunities to encapsulate one analysis into another.
Fault Tree Analysis
BlockSim’s fault tree analysis interface supports all of the traditional gates and event symbols that are applicable to system reliability and related analyses. In addition, only BlockSim allows you to expand the modeling capabilities with additional logic gates that represent load sharing and standby redundancy configurations. The available event symbols include Basic, Undeveloped, Trigger, Resultant and Conditional, while the supported fault tree diagram gates include:
- AND and OR gates
- NOT, NAND and NOR gates
- Voting gates
- Inhibit gates
- Priority AND and Sequence Enforcing gates
- Load Sharing and Standby gates
Fault tree diagrams can be configured to display intermediate results at each individual gate. Your BlockSim projects can contain both fault trees and reliability block diagrams together in the same analysis workspace. You can also integrate your fault trees and RBDs by linking a fault tree as a subdiagram to an RBD or vice versa, copying events from a fault tree diagram and pasting them as blocks in an RBD, and automatically converting any fault tree to an RBD.
Markov Diagrams
Markov diagrams allow you to model the behavior of a system in various states using a memoryless process, where the next state of the system is only dependent on the transition values and the current state of the system. This gives you the ability to look at partial or degraded working states, and to start analysis in varying states. If you have both RENO and BlockSim, you can analyze a Markov diagram during a RENO simulation and use the analysis result in your RENO flowchart.
Reliability Analysis via Analytical Diagrams
System reliability metrics and plots: You can use the convenient Quick Calculation Pad (QCP) and plot sheets to calculate and visualize key system reliability metrics such as:
- Reliability and probability of failure
- Reliable life (i.e., time for a given reliability)
- BX% life (i.e., time for a given unreliability)
- Mean life
- Failure rate
Minimal cut sets: For each analytical diagram, BlockSim identifies the unique combinations of component failure that can cause system failure. These minimal cut sets can be used to understand the structural vulnerability of a system.
Identify critical components: FRED Reports (Failure Reporting, Evaluation and Display) provide an intuitive graphical presentation of key metrics, with color-coding to identify the ones that may be critical for system improvement. FRED reports are available for analytical and simulation diagrams.
Reliability importance plots: BlockSim provides a set of Reliability Importance plots designed to show the relative importance of each component with respect to the overall reliability of a system.
Optimum Reliability Allocation
BlockSim provides a tool dedicated to helping you find the most effective reliability allocation to meet a system’s reliability goal. This feature supports Equal, Weighted and Cost Optimized methods. Start at the system level and click your way to the component or failure mode level while the software automatically computes the target reliability for each item/mode and transfers it to the next.
Availability Analysis via Simulation Diagrams
BlockSim’s simulation capability for reliability, availability, maintainability and supportability analysis of repairable systems is more flexible and realistic than ever. For a new system, you can use simulation results to optimize the design and make projections about how the system may perform in the field. For existing equipment, use the results for maintenance planning, throughput estimates, life cycle cost estimation and more.
When you utilize simulation, the analysis can consider:
- Task scheduling logistics, which includes a “Virtual Age” option for situations in which the scheduled maintenance task will be performed even if the item has failed.
- Restoration factor that captures the impact of repairs on the future reliability of the component.
- Duty cycles for components (or assemblies) that experience a different stress load than the rest of the system.
- Expected downtime associated with corrective or scheduled maintenance.
- Costs and logistical constraints associated with allocating the personnel (repair crews) and materials (spare parts) required to perform maintenance.
- Maintenance groups that identify components that will receive maintenance based on what happens to other components.
- State change triggers that activate or deactivate a block under certain conditions during the simulation. This provides increased modeling flexibility for highly complex dependency scenarios, such as standby configurations and other situations when you may need to divert the simulation onto an alternate path when a particular event occurs.
BlockSim’s simulations generate a wide variety of results at the system and/or component level (such as Uptime/Downtime, Mean Time to First Failure (MTTFF), Availability, Reliability, Number of Failures, Number of PMs/Inspections, Costs, etc.). You can use these results for many different applications, including:
- Choosing the most effective maintenance strategy based on considerations of safety, cost and/or availability.
- Using the optimum replacement tool to calculate both the optimum preventive maintenance (PM) and/or optimum inspection intervals.
- Managing the spare parts inventory based on considerations of cost, utilization rate, supply bottlenecks, etc.
- Identifying the components that have the biggest impact on availability (downtime).
The software’s Log of Simulations feature provides the information you need to evaluate the variability in specific simulation results of interest.
Life Cycle Cost Estimation
BlockSim allows you to specify both the direct and indirect costs associated with the maintenance strategies that you have defined, including costs related to downtime, maintenance crews, spares, etc. This yields a wide array of simulation results that are instrumental in performing realistic LCC assessments. With BlockSim’s modeling flexibility, you can:
- Specify what kinds of crew delays are included in cost calculations and what delays should be ignored.
- Specify costs associated with system failure, including cost per incident and downtime rate.
- Specify system uptime revenue and revenue due to throughput so the simulation is able to calculate opportunity costs.
- View new cost-related simulation results, including system-level costs, the contributions of different kinds of wait times to block costs and the contribution (criticality) of a block’s cost to the total system costs.
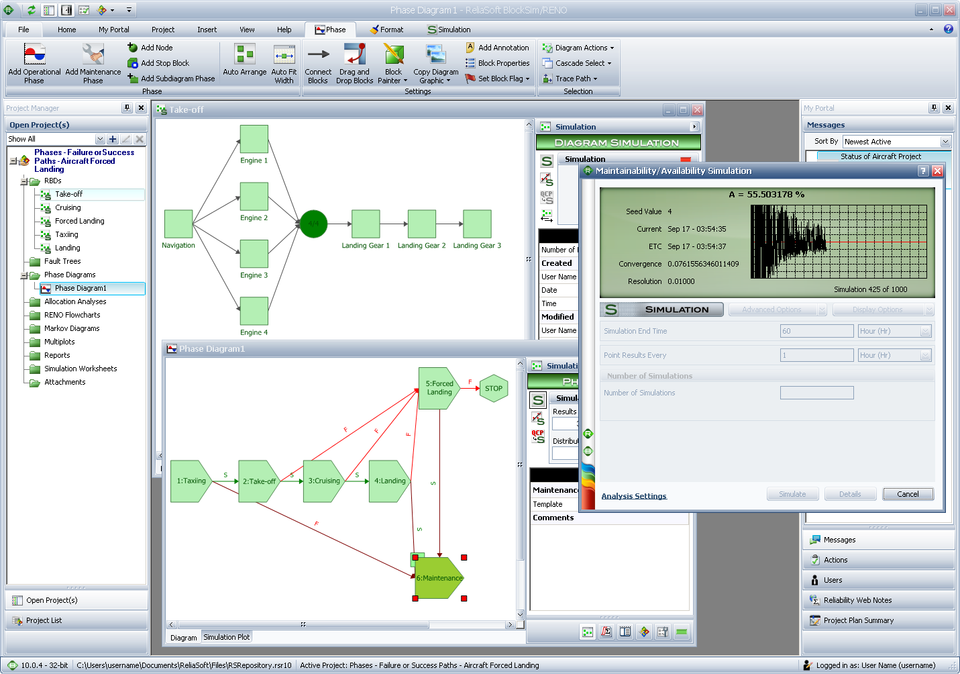
Phase Diagrams
You can use reliability phase diagrams (RPDs) to model systems that go through different phases during the course of their operation. For example, some aircraft components operate only during the take-off and landing phases of a mission. Other components may experience a higher failure rate during certain phases due to higher stress.
In addition, the software uses Maintenance Phases to model scenarios in which a system goes directly to maintenance under specified conditions. For example, if a failure during the taxi phase sends an aircraft in for maintenance, it will start over from the beginning of the mission once repaired — not from the middle of the taxi phase where it was when the failure occurred, as other RBD analyses have been forced to assume. This flexibility provides a tremendous leap forward in the ability to simulate system operation more realistically.
BlockSim includes success/failure paths, for situations where a system proceeds to one operational phase upon success and a different operational phase upon failure. Node blocks and stop blocks are included as well.
Throughput Analysis
BlockSim throughput analysis capabilities can be used to identify bottlenecks, optimize resource allocation and otherwise improve the processing efficiency of the system.
The software allows you to determine how the simulation will allocate the processed output across the paths defined in the diagram. The software also allows you to specify how the backlog will be processed. When the throughput varies over time, BlockSim phase diagrams can be combined with models to describe the time-dependent variability (linear, exponential or power).
“What-if” Scenario Simulation Using Variables
The Simulation Worksheets feature allows you to vary values that are used in BlockSim RBD or RENO flowchart simulations. This enables you to investigate the effect of one or more variables on the simulation results. Two of the most useful applications are the ability to:
- Design an experiment in Weibull++ —> simulate the experiment in BlockSim or RENO —> then return to Weibull++ and analyze the simulated “response” data.
- Perform batch simulation of an RBD, using different input values for each simulation. For example, this tool makes it easy to run a set of simulations that compare a variety of possible scenarios by altering specific inputs (e.g., cost, maintenance interval, etc.) for each simulation.
Multi-thread Support and Batch Mode
BlockSim allows you to run simulations in multiple threads. This may improve performance and save time when simulating complex diagrams. Additionally, the Batch Mode feature improves productivity by allowing you to schedule a series of simulations in advance. For example, you can set the simulations to run overnight and find the results waiting for you when you return to your desk in the morning!
Plots and Reports
Plots and charts to visualize your analysis results:
- Plot setup allows you to completely customize the “look and feel” of plot graphics while the RS Draw metafile graphics editor provides the option to insert text, draw objects or mark particular points on plot graphics. You can save your plots in a variety of graphic file formats for use in other documents.
- Overlay plots allow you to plot multiple results together in the same plot. This can be an effective visual tool for many different purposes, such as comparing different analyses (e.g., Design A vs. Design B) or demonstrating the effects of a design change (e.g., Before vs. After).
Customizable reports: The Synthesis Workbook is a custom reporting tool that is built into BlockSim. It seamlessly integrates spreadsheet and word processing capabilities while enabling you to include calculated results and plots from your analysis.
Whats New in 2019
Process Flow
Version 2019 of ReliaSoft BlockSim has a new module called Process Flow that is specifically designed for continuous throughput plants or processes (such as petrochemical or water treatment plants) in order to better model and understand throughput, availability, and efficiencies. It allows the user to input reliability and availability information for their equipment within the process – much the same way as a traditional RBD does – but enables the use and combination of multiple types of flows to model availability and production. This product option is available at an additional cost.
Teams / multiple crews for tasks
In Version 2019, users are able to assign tasks to crews as a part of the teams. This allows users to require multiple crews to complete a task. Teams for task allows you to choose or create one or more teams that can perform the task. Each team is made up of one or more crews; all crews assigned to the team are considered to be required. You can add, remove or edit the crews assigned to any team. You can also remove a team from the task, thereby quickly removing all of its crew associations.
Multiple spare part pools for tasks
Tasks can now request multiple spare parts from a pool. All requested parts must be delivered before the task can be performed. In addition, multiple spare part pools can be assigned to tasks. In this case, the task is assumed to require all requested parts from all requested pools.
For each task, you now need to specify a quantity of parts requested from the pool by the task. The default value in the Quantity requested by task field is 1.
You can assign multiple spare part pools to a task. In this case, the task is assumed to require all requested parts from all requested pools. In other words, the pools are in an AND relationship, not an OR relationship.
Spare part pool profile models for cost and duration
Spare part profile models can be used to define any acquisition time and non-holding costs. This new model type allows you to model changes in cost and duration over time.
Identical block simplification setting for subdiagrams
Users now have the option to apply the same setting to all of the current diagram’s subdiagrams, and their subdiagrams, etc.