

ReliaSoft RCM++
ReliaSoft RCM++ software facilitates the Reliability Centered Maintenance (RCM) analysis approach for creating scheduled maintenance plans, which is an important aspect of an effective asset management program.
The software provides support for the major industry RCM standards, such as ATA MSG-3, SAE JA1011 and SAE JA1012. RCM++ offers extensive configuration options to fit your organization’s particular RCM analysis approach. It also provides full-featured capabilities for FMEAs and related analyses.
- Supports major RCM standards such as ATA MSG-3, SAE JA1011 and SAE JA1012.
- Includes configurable equipment selection, failure effect categorization and maintenance task selection capabilities.
- Flexible and intuitive interface for defining your system configuration and recording the functional failure analysis.
- Enables simulation-based calculations that can be used to compare the costs of potential maintenance strategies and a calculator to estimate the optimum maintenance interval for preventive repairs/replacements.
Benefits
- Develop a scheduled maintenance plan for a physical asset that will provide an acceptable level of functionality, with an acceptable level of risk, in an efficient and cost-effective manner.
- Evaluate whether preventive maintenance (PM) is appropriate and determine the optimum preventive maintenance intervals.
- Promote analysis processes that are more efficient and more effective, utilizing lessons learned from past analyses when applicable.
Capabilities
RCM Standards RCM++ provides predefined profiles that make it easy to configure the analysis workspace to fit the major RCM and FMEA reporting standards, such as:
- SAE JA1011/1012 for RCM
- MSG-3
- NAVAIR 00-25-403
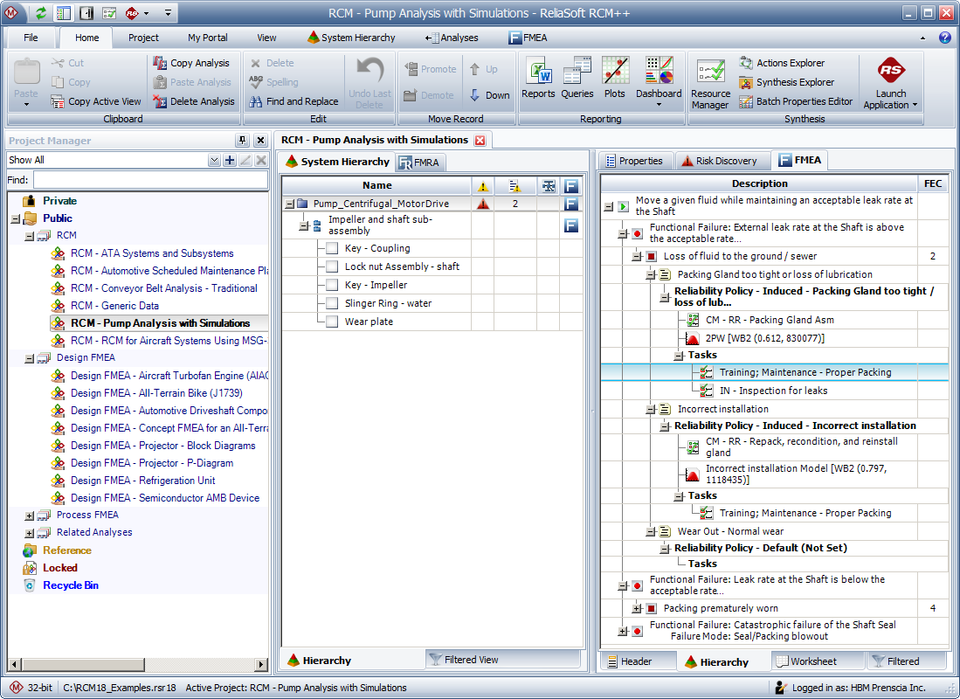
In addition, the software offers flexible capabilities to customize any of the sample profiles or create your own settings to meet the specific needs of your organization. Reliability Centered Maintenance (RCM) Analysis Equipment Selection In order to focus resources where they can provide the greatest benefit, the Risk Discovery Analysis feature provides a choice of two configurable methods to determine which equipment will be analyzed with RCM techniques. Functional Failure Analysis The Analysis panel makes it easy to switch back and forth between three complementary views of the functional failure analysis information so you can choose the display that is best suited for your current activity.
- The FMEA Hierarchy displays a lot of information in a compact space. Now you can choose to display and enter causes before effects, if desired.
- The Worksheet View allows you to type directly in the worksheet cells and tab through the analysis as you would in a spreadsheet application such as Microsoft Excel.
- The Filtered View allows you to generate sortable lists of records of a particular type. For example, you may wish to see maintenance task records sorted by type, assigned interval, duration or cost.
Failure Effect Categorization and Maintenance Task Selection RCM++ supports the failure effect categorization (FEC) and maintenance task selection logic charts in the major industry RCM standards. You also have the option to customize the questions, categories and task types to fit your own specific analysis procedures. These configurable logic diagrams can help guide the analysis team to discuss the consequences of potential failure modes and consider the maintenance strategy that will be most applicable and effective. Task Packaging RCM++ makes it easy to group individual tasks into packages based on factors such as time (scheduled interval), task type and areas in the system where tasks are performed. You can manually assign a task to the appropriate maintenance package or allow the software to automatically group tasks based on the criteria that you have specified for each package. Maintenance Strategies Maintenance Strategies Based on Cost and Availability Even when you choose to use the predefined decision logic diagrams employed by traditional RCM methods, those guidelines still require the analysis team to utilize their knowledge of the equipment’s failure behavior when making decisions about the appropriate maintenance strategy. RCM++ provides built-in simulation and calculation engines to help with these assessments. Variety of Statistical Distributions to Describe the Failure Behavior RCM++ allows you to more accurately describe the probability of failure by providing a choice of ten distributions. Integration with Weibull++, ALTA and BlockSim software tools makes it possible to obtain the failure time distribution and parameters from an existing data analysis or RBD/fault tree. The software also provides the Quick Parameter Estimator (QPE) utility to help you estimate the distribution parameters based on limited information. Maintenance Strategies Based on Cost and Availability RCM++ makes it possible to simulate the operation of the equipment with different potential maintenance strategies in order to estimate the expected failures for each scenario and calculate the Average Availability, Cost per Uptime and Total Operating Cost. Failure Modes and Reliability Analysis (FMRA) Failure modes and reliability analysis (FMRA) feature helps you to integrate statistical reliability analysis calculations into your FMEA and RCM activities. It can be used to:
- Display all of the FMEA records that could have an impact on system reliability/maintainability to define the relevant reliability characteristics.
- Calculate the probabilities of failure required for a quantitative criticality analysis.
- Use the occurrence ratings to generate a preliminary baseline reliability estimate.
- Synchronize with BlockSim’s reliability block diagrams (RBDs) or fault trees.
- Allocate the target reliability and target availability.
Optimum Replacement Interval RCM++ provides a utility to automatically calculate the optimum replacement interval that will minimize corrective and preventive maintenance costs. The utility allows you to calculate the optimum time for an individual item, or to calculate a time that will be optimum for a specified group of items. FMEAs and Related Analyses RCM++ provides a complete set of features for FMEA and related analyses, which can be used independently or integrated with any RCM analysis. For example, you may wish to use RCM for some equipment and FMEA for other equipment, depending on the assessed criticality. Alternatively, you may wish to incorporate the Risk Priority Number (RPN) method as an additional risk assessment tool in some of your RCM analyses. The software also provides configurable utilities for:
- Design Verification Plans and Reports (DVP&Rs)
- Process Flow Diagrams (PFDs)
- Process Control Plans (PCPs)
- Design Reviews Based on Failure Mode (DRBFMs)
- P-Diagrams
Queries, Reports, Charts and Diagrams RCM++ makes it easy to generate reports in the tabular worksheet format that is commonly used for RCMs, FMEAs and related analyses. The software provides a complete range of options for presenting the data in ways that will effectively communicate results and facilitate decision-making.
- Queries and Print-Ready Reports Use the Templates Manager to manage predefined and customized templates that can be made available to all database users, applied to any data set and incorporated into any print-ready report document.
- The Query Utility window is a powerful analysis tool that makes it easy to find and open specific sections of the analysis. It is also a flexible custom reporting tool that allows you to create and manage saved queries that meet your particular presentation requirements.
- The Reports window makes it easy to build report documents that include the predefined report forms, custom report forms and/or custom queries that will be most effective to present your analysis results. Since you can generate these documents directly in Microsoft Word or Excel, it is easy to customize and distribute reports without a specialized report editor or viewer.
If your organization chooses to implement a web-based Synthesis Enterprise Portal (SEP) for an enterprise database, you can also publish these reports to the portal (in Word, Excel, PDF or MHTML format), where they can be accessed from any web-enabled device.
- Charts and Diagrams The Plot Viewer provides an array of flexible options to create attractive bar charts, pie charts and matrix charts based on the analysis data. The software also generates Cause and Effect Diagrams and Failure Relationship Diagrams to help you visualize the relationships between issues in your analyses.
- FMEA/FMRA Dashboards You can create customized dashboards to present data from FMEA and FMRA analyses in XFMEA/RCM++/RBI. In addition, if your organization chooses to implement a web-based portal for an enterprise database, you can now share selected dashboards to be accessed from any web-enabled device.
Data Management Tools and Utilities RCM++ flexible data management capabilities can save time on data entry, help to ensure consistency among analyses and even provide brainstorming tools that will improve the quality of your RCM analyses. The software provides an array of tools to help you find and reuse descriptions from any existing analysis and to select phrases from predefined templates or phrase libraries. You also can use fully customizable Excel® templates to quickly import system configurations and/or analysis data from external data sources. The software gives you an ability to import system configuration data from XFMEA, RBI, MPC and XFRACAS. FRACAS Integration You can automatically import system configuration data from an external Bill of Materials file or from ReliaSoft XFRACAS web-based failure reporting and incident tracking system. For an enterprise database, you can maintain a direct link to the XFRACAS system, which makes it easy to resynchronize at any time. This FRACAS connection also enables the FMEA team to tap into valuable information about failure modes that are observed during testing and in the field, including incident quantities and new failure modes that may not have been considered yet.
Whats New in Version 2019
Teams / multiple crews for tasks
In Version 2019, users are able to assign tasks to crews as a part of the teams. This allows users to require multiple crews to complete a task. Teams for task allows you to choose or create one or more teams that can perform the task. Each team is made up of one or more crews; all crews assigned to the team are considered to be required. You can add, remove or edit the crews assigned to any team. You can also remove a team from the task, thereby quickly removing all of its crew associations. If multiple teams are assigned to the task and a team is needed, they will be checked for availability in the order in which they are displayed in this list. If a team is needed and all teams are engaged, the team with the shortest wait time is chosen to perform the task.
Multiple spare part pools for tasks
Starting in Version 2019, tasks can request multiple spare parts from a pool. All requested parts must be delivered before the task can be performed. In addition, multiple spare part pools can be assigned to tasks. For each task, you now need to specify a quantity of parts requested from the pool by the task. The default value in the Quantity requested by task field is 1.
Spare part pool profile models for cost and duration
You can also assign multiple spare part pools to a task. In this case, the task is assumed to require all requested parts from all requested pools. New in Version 2019, profile models can be used to define any acquisition time and non-holding costs. This new model type allows you to model changes in cost and duration over time. You can also still use all other model types for these fields.
Update RBI to American Petroleum Industry RP 581 Rev 3 (2016)
Starting with Version 2019, RBI will be configured to follow the API RBI Rev 3 (2016) standard and all calculations and recommendations that follow.